It takes a one day four or five dollar move on Tesla to make a decent gain on a mid week move in Call or Put options on this stock. Here is one example. It's all about a technical break out if you believe in that kind of stuff. This action has being going on for years and some traders are very good at playing it. Let's start by looking at this chart. It's not however a mid-week snapshot of Telsa.

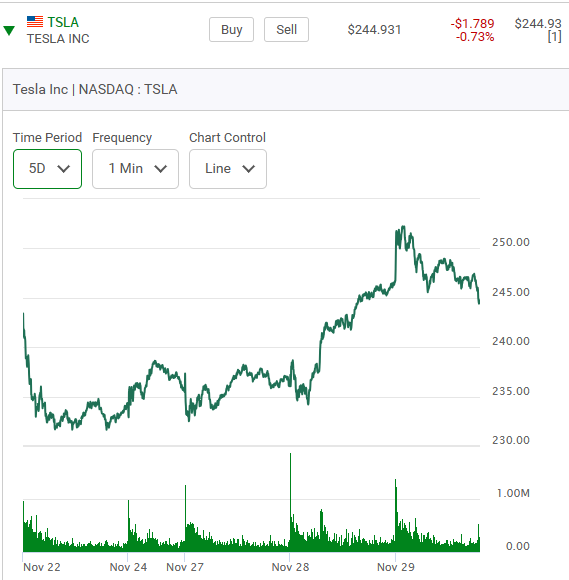
This is a chart of how Tesla traded last Friday morning. Yes you could be playing one day options on it (options that expire at 3:00 p.m. that afternoon). In this case get in around 10:30 a.m. and out at 12:01 p.m.That's mad money trading and is a different animal to be playing than mid week options on Tesla. It's mad money because if I said around 10:00 a.m. and out at around 12:01 p.m. the outcome would have being entirely different. So today is Wednesday November 29th and here is a mid afternoon look at how Tesla is trading. Wednesdays are often days of a market reversal. This is a five day chart. Can you see how the stock popped on the opening and then started to come off in the afternoon?
Now look at these the 240 series of Call options at 2:42 p.m. that expire this Friday.
Can you see how these options jumped to $13.55 in the morning activity? Now scroll back up and look at the chart. Can you see how the stock surged upwards on the previous days closing? Wouldn't it take guts to be buying in at 3:59:55 p.m. or 3:59:56 "at market"on the previous day just before the close at market? When the stock was spiking like that near the close wouldn't you be expecting some kind of a breather on the following opening? I would be even if there is good news happening. Here now is it's full one day chart on Wednesday and it shows how it powered up in the first few minutes of trading. The 240 series of Calls more then doubled on the opening! It was a great trade but I called it the stupidest of trades in the heading. Look at the high volume of trading. Some traders, (not me) even the ones who bought in on the opening, did well on their Call options in a matter of only a few minutes.

All I know is that had you bought a 240 series Put in the previous day at around 3:59:55 (why wait until the last few seconds) "at market" you would have made money because the stock closed down $2.60 on the day. What a stock to be trading options on! So many traders know this.
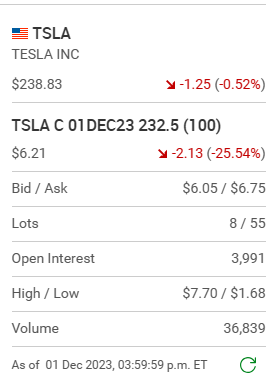
A quick end of the week (Dec 1st) review. Here is a five day chart of the action and a look at the 232.50 Calls on Telsa today (a Friday).
Look at how the 232.50 series of Calls traded today. Yes there was some action.


Comments