Posts

Showing posts from September, 2022

Featured

This One Is Too Nervous To Watch. Pfizer

This is a short blog full of twists. Try to get through it. First a five day chart of Pfizer. chart. In the past week it was up $1.05 and it was the 7th most activity traded stock on the NYSE most active list. It's in a breakout mode. Look at how it traded over the last three years. This breakout mode might last a few days, weeks or months. This stock has a history of moving somewhat slower than most stocks. A second quarter earnings report comes out July 30th. If it's good that could add a touch to the stock's price. Now this. As a general rule stocks and options on stocks in this particular price range are difficult to play and in this case everyone is following the same story. Fred down the street and John around the corner and Mark across town are all dialed into the same commentary. There is nothing that really gives you an edge when it comes to playing it. That's the problem. Here now is a look at the Pfizer "next-week-out" $30.00 series of Call optio

A Plan to Get a Free Cruise in 2024

Image
Carnival got stuck in the mud today after an earnings report was released showing a slight loss. See the chart below. Why isn't credit being given to this company for all of its diligent work? Afterall, 95% of their fleet is back out sailing the oceans once again at a 85% occupancy rate. Can you believe these numbers are this high? Think of where things were at one year ago. Who would ever dream such a turnaround could happen so quickly? Carnival now just has to tweak their numbers. (Yes they had to take on some additional debt to keep things floating but the worst seems to be over now). So my question now is where do you want to sail to in 2024? Start planning? Start buying a couple of long term Carnival Call options now.Your profits from such a trade could pay for your trip. Note I am not a financial adviser and these claims may be without without proper logic on my part. Call me a dream weaver. This was a tough week on the stock. Now a longer term look at the stock. I think i

Home Depot - Snakes and Ladders- Hurricane Season- Hurricane Ian

Image
Here is a one day chart and a five day chart. Home Depot closed up $2.30 on the day however the markets were off. Home Depot can jump in Hurricane Seasons. Now the five day chart. Here is my buy in at the end of the day with three seconds to go. Look at how these options traded on the day. Florida might get hit tomorrow. Talk like this can go away as fast as it came. Two days ago no one saw this coming. An 8:30 a.m. Wednesday update. Let's back up a second. Look at how strongly Home Depot opened up yesterday and look at how light the volume was on the day. In a way this play is "old news" and the question is, am I one day late in coming to the party? These options still have three days trading life left in them. Do I want excessive demands on my time going forward? Is this a wise application of effort and creative energy? I could bail in the premarkets and take a profit and never have to follow this news again. The connection between Home Depot going up in price and h

Ford - One Billion Dollars

Image
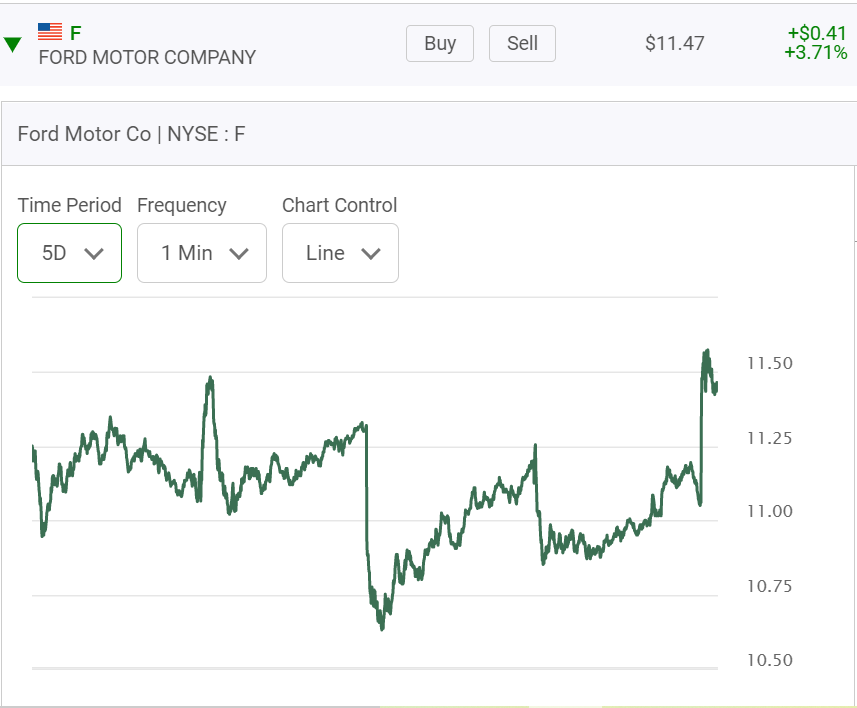
Here are two random five day charts on Ford. This second chart is a reaction to an earnings report. The stock has no problem jumping up and down. Here is the action on Sept 20th, the biggest one day loss in over ten years. On this news the January 14th 2023, series of Calls sold off almost 50%. Here is a one year chart. Going electric is going to cost billions of dollars. If this stock wiggles down a tad more this would be an excellent entry point. Releasing this news today was somewhat irresponsible. It could have waited until it's next earnings report. Further guidance offered today calls for a return to normality. What do you think? Here they are again two days later on Sept 23th They are now down about 25% in two trading days with the stock down another chunk. Ford frequently has news. Good news will cause it to rebound.

The Chaff From The Hay - Deere

Image
Here is Wall Street putting a spin on farming. What does all this mean for Deere and how this stock trade? Look at it's one year chart. I have talked about options on Deere before. It's options are thinly traded and money can be made taking postions thirty days out and guessing right which direction it is going to go. Stories like this can help to change the needle. Now I would like to show you an example of an October "out-of-the-money" Calls.It is buying one months of time. Deere is at $372.00 and it would have to go up to $385.00 just to break even. Look at the chart. Is that a reasonable expectation? On first glance you might say that this series of Call option is to expensive. You might also say look at how insignificantly small the "open interest" is. Let's now move forward one week and show a one week chart on Deere and revisit these Call options to see where they are now trading. Ouch! That's what happens when Deere drops eighteen dollars